Chrome can use several gigabytes of RAM with surprisingly few tabs because the browser is not one program doing one job. It runs renderers, extensions, GPU work, network services, and the browser interface in separate processes. That isolation helps one broken page fail without taking every tab with it, but each process has overhead.
The painful part is not the number by itself. It is seeing Chrome at 5 GB while a video editor or game crashes, then having no idea which page to blame. One r/chrome user reported exactly that with “only 10 tabs” and Memory Saver already enabled.
Do not begin by deleting your history or closing everything. Save active work, open Chrome Task Manager, sort by memory, and isolate one variable at a time. If the real problem is a backlog of tabs rather than one faulty site or extension, Tabbit Browser can help you organize and reduce that backlog. It is not a RAM-cleaning utility, and this guide will keep that distinction clear.
Key takeaways
High RAM is not automatically a leak. Chrome's process isolation deliberately trades some memory for stability and security.
Use Chrome Task Manager instead of relying on the operating system's aggregated list to match memory use to a specific tab, extension, GPU process, or service.
Compare repeatable baselines. One screenshot cannot tell you whether a process is caching normally or growing without limit.
Memory Saver does not deactivate every idle-looking tab. Media, downloads, forms, notifications, pinned tabs, and connected devices can keep a tab active.
Tabbit helps when tab sprawl is the cause. It does not fix a heavy web app, a leaking extension, or a computer that lacks enough physical memory for the workload.
Chrome memory symptoms at a glance
| What you see | Likely explanation | First check | Do not start with |
|---|---|---|---|
| Many Chrome processes with one visible tab | Browser, renderer, GPU, services, and extensions are separated | Chrome Task Manager task names | Ending every Chrome process in the OS task manager |
| One tab grows while you keep using it | Heavy document, media buffer, cache, or a page leak | Repeat the same action and watch that task | Assuming every value above a fixed MB threshold is broken |
| RAM stays high after closing the page | Extension, service worker, browser cache, or another Chrome window | Sort all Chrome tasks and check extensions | Clearing all cookies and losing sessions |
| Memory Saver ignores a tab | The tab is active by Chrome's rules or is excepted | Audio, calls, forms, downloads, pinning, exceptions | Installing another tab-suspension extension immediately |
| Other apps crash or the system swaps | Total workload exceeds available memory, or one task is runaway | OS memory pressure plus Chrome's per-task list | Debating whether unused RAM is “good” in the abstract |
If your main problem is unreadable tab clutter rather than system pressure, the Chrome tab-group guide and vertical tabs guide solve a different part of the problem. Organization makes diagnosis easier, but it does not prove that RAM has been released.
Why Chrome uses more than the page in front of you
Chromium's official multi-process architecture document explains the basic trade. Renderer processes are separated so a broken or compromised page has less ability to affect other tabs or the system. Chromium also runs separate GPU, network, storage, and utility processes.
“One tab equals one process” is only a shortcut. A tab can contain frames from different sites, related tabs may share a renderer, and Chrome may reuse processes when it reaches a limit. The useful lesson is simpler: the total shown beside Chrome in Windows Task Manager or macOS Activity Monitor is an aggregate, not the identity of the culprit.
A small tab count can still be heavy. A commenter on the original Reddit thread put it plainly: “each separate tab of a Google Doc or Sheet, or ChatGPT, is an entire web app in itself.” That is a personal observation, not a benchmark, but it describes the right mental model. A spreadsheet, editor, meeting, or social feed can keep far more live state than a static article.
Chrome also uses memory to avoid doing the same work again. Cached page data can make switching back faster. A high number with no memory pressure and no continuous growth may be normal for that workload. A number that rises every time you repeat one action and never settles deserves investigation.
The 10-minute Chrome RAM diagnosis
Before you touch settings, save any draft, upload, form, or edit that would be painful to lose.
1. Check whether the computer is actually under pressure
Open Windows Task Manager or macOS Activity Monitor. Look at total memory use, swap or page-file activity, and whether the system reports memory pressure. Note what else is running. A post on X recommends the same first move: “Open Task Manager. Sort by Memory.” The post is not a technical authority, but the sequence is sound.
If the system has plenty of free memory and feels responsive, optimize only if one Chrome task keeps growing. If the system swaps heavily or closes other apps, continue.
2. Open Chrome Task Manager
Use Shift+Esc on Windows, Linux, or ChromeOS. On macOS, use Window > Task Manager. You can also open Chrome's menu and find Task Manager under the tools submenu, though menu labels can vary by version.
Click Memory footprint to sort descending. Record the top five task names and values. Also glance at CPU and network activity. A task using memory because it is actively rendering a call is different from a forgotten background extension that climbs while idle.
3. Map the task to a page, extension, or service
Chrome Task Manager labels tabs by page title and extensions by name. Other entries may include Browser, GPU Process, Network Service, Service Worker, or subframes.
A named page at the top points to a tab-level test.
An extension name points to an extension isolation test.
GPU Process suggests video, WebGL, canvas work, driver behavior, or many accelerated surfaces.
Browser or Network Service requires a broader clean-profile or restart comparison; ending random tabs may not touch it.
Do not end a process merely because it ranks first. Save work, then test whether its value changes in a repeatable way.
4. Capture a baseline, change one thing, and repeat
Use the same five-minute routine twice. Open the same pages, perform the same actions, wait the same amount of time, and record the top tasks. Then change one variable: close one suspect tab, disable one extension, or restart Chrome with the same pages.
The comparison matters more than the absolute number. Different operating systems, Chrome versions, page states, screen sizes, and extensions make universal “normal MB per tab” rules unreliable.
How to prove a tab is the culprit
Start with the highest named page in Chrome Task Manager.
Save work in that page.
Note its Memory footprint and whether the value is stable.
Repeat the action that seemed to trigger the problem: scroll a feed, edit a large sheet, join a call, or switch a dashboard filter.
Stop interacting and watch for two minutes.
Close only that tab, then check whether total system pressure and Chrome's task list fall.
If reopening the same page and repeating the same action reproduces the growth, you have a strong page-level signal. Try the site in a fresh incognito window with extensions disabled where practical. If the issue disappears there, the site and an extension may be interacting.
Ending the tab's process is useful when the page is unresponsive, but it is not a diagnosis by itself. The page may release memory normally after a reload. Conversely, a page can look fine while retaining more data after each repeated action.
When dozens of tabs make this inspection impossible, first reduce visual noise with an AI tab manager or a clear browser productivity setup. Keep the diagnosis separate from the organizer: a neat group of 40 live pages can still use substantial memory.
How to prove an extension is the culprit
Open chrome://extensions and list the extensions that can read or change data on many sites. Coupon tools, grammar helpers, password managers, blockers, new-tab replacements, and developer tools can all be legitimate, but broad access gives an extension more opportunities to run.
Use an A/B test:
Record a normal-session baseline with Chrome Task Manager.
Disable one suspect extension.
Fully restart Chrome.
Reopen the same small test set of pages and repeat the same actions.
Re-enable the extension once to see whether the behavior returns.
Do not disable every extension at once unless you only need a quick yes-or-no answer. If the problem disappears, you will still not know which extension caused it. Binary isolation is faster for a long list: disable half, retest, then keep dividing the suspect group.
Remove an extension only after you confirm you no longer need it or can replace it safely. For a work-managed browser, ask the administrator before changing security, identity, or compliance extensions.
If you are considering another Chromium browser, read the Tabbit vs Chrome comparison or the broader Chrome alternatives guide. The same Chrome extension may reproduce the same problem after migration.
Why Memory Saver may appear not to work
Google's current Chrome performance help says Memory Saver deactivates tabs you are not using and reloads them when you return. Current desktop settings offer Moderate, Balanced, and Maximum deactivation levels.
Chrome deliberately keeps some tabs active. The official list includes active audio or video, calls, screen sharing, page notifications, downloads, partially completed forms, pinned tabs, and connected USB or Bluetooth devices. A site in Always keep these sites active is also exempt.
That explains a common mismatch: a tab can look idle to you while Chrome sees work that must not be interrupted. Before calling Memory Saver broken, hover the tab with memory display enabled, check the exception list, and look for one of those active conditions.
Use Maximum only if faster deactivation fits your work. A form, long-running dashboard, or media workflow may need an exception. More aggressive sleeping can trade memory for reload delays or lost transient state.
The next CSV topic covers Memory Saver failures in depth. Here, the practical rule is to use Memory Saver after you identify the workload, not as evidence that every background tab must already be empty.
A practical option for tab sprawl: Tabbit Browser
Suppose Chrome Task Manager shows no single runaway tab. Instead, the total comes from a long tail of research pages, duplicated searches, stale dashboards, and projects that should have been closed last week. This is where Tabbit Browser can help.
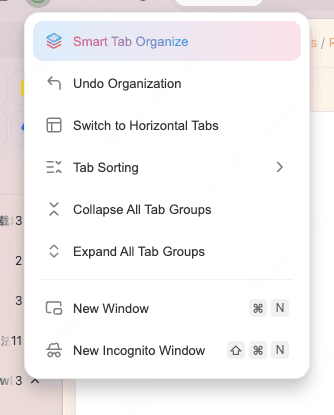
Tabbit's Smart Tab Organization groups open pages by topic. The useful result is not a magical RAM reduction. It is a reviewable map of the session. You can inspect one project at a time, keep the pages that still matter, and close the expired or duplicate group instead of scanning a compressed horizontal tab strip.

A simple workflow is:
Run the Chrome diagnosis first and save important work.
Install Tabbit and import the browsing data you want to keep.
Use Smart Tab Organization on the busiest project window.
Review every proposed group. Close duplicates and expired tasks; keep active calls, forms, and uploads separate.
Recheck system pressure with the same workload.
This complements an AI tab organizer workflow and project-based browser workspaces. It does not prove Tabbit will use less memory for the same ten heavy web apps. Tabbit is also Chromium-based, and a faulty extension or demanding page can remain faulty after the switch.
Which action fits your situation?
| Situation | Best next action | How to preserve your place | Is Tabbit a fit? |
|---|---|---|---|
| One page grows every time you repeat an action | Reproduce in incognito, update the site/browser, report the page issue | Save the document or copy the URL before ending the task | Not the primary fix |
| One extension reproduces the growth | Disable, update, replace, or report the extension | Export its data or settings if needed | Only if you do not bring the faulty extension over |
| Many valid tabs create a steady total | Group by project, close expired work, use Memory Saver | Save groups, bookmarks, or a project workspace | Yes, Smart Tab Organization can reduce review effort |
| Active media, forms, calls, or downloads stay awake | Keep necessary tabs active and close unrelated work | Add narrow Memory Saver exceptions | Possibly, but do not expect active tasks to sleep |
| The same workload exceeds physical RAM in every browser | Reduce concurrent apps or upgrade memory/hardware | Restore a smaller session after the upgrade | No browser can create physical RAM |
| You want a browser designed around organized AI work | Compare workflows and migrate a test profile first | Import Chrome data, then verify critical extensions | Yes, if Tabbit's workflow fits your needs |
For a buying-style comparison, see the lightweight browser guide. Do not choose from a generic ranking until you reproduce your own workload. “Lightweight” changes with the pages and extensions you actually run.
When to upgrade hardware or file a bug
Consider more physical memory when your normal, necessary workload exceeds available RAM across clean browser profiles, and you must run other memory-heavy apps at the same time. Video editing beside several web apps is a different workload from casual browsing. No setting can remove that basic capacity requirement.
File a site or Chrome bug when a clean profile reproduces unbounded growth, a single repeatable action causes a large jump that never returns, or the page crashes consistently. Include Chrome version, operating system, exact steps, a minimal URL if it is safe to share, and a Chrome Task Manager screenshot with private information removed.
Avoid “RAM cleaner” tools as the first response. Forcing cached memory out can make a number fall temporarily without fixing the process that keeps allocating it. Diagnose the owner of the memory first.
Final verdict
Chrome uses a lot of RAM partly because its separate processes protect stability and security, and partly because modern web pages behave like applications. The reliable fix is not a universal memory limit. It is attribution: check system pressure, sort Chrome Task Manager, reproduce the workload, and change one variable at a time.
If you find one bad tab or extension, fix that root cause. If you find a crowded session with no single runaway task, organize the work and close what has expired. That is the case where Tabbit is useful.
Install Tabbit Browser, import a test profile from Chrome, and run Smart Tab Organization on one busy project. Keep your original Chrome profile until you have verified important extensions and workflows. A controlled test tells you more than any generic RAM claim.
FAQ
Why does Chrome use so much RAM with one tab open?
Chrome still runs a browser process, renderer, GPU process, network services, and installed extensions when one tab is visible. A modern web app may also keep a large document model, media buffers, or cached data in memory, so tab count alone is a poor measure.
How do I see which Chrome tab uses the most RAM?
Open Chrome Task Manager with Shift+Esc on Windows, Linux, or ChromeOS, or through Window > Task Manager on macOS. Click Memory footprint to sort the list, then match the heaviest task to its tab or extension before ending anything.
How do I tell whether a Chrome extension is leaking memory?
Record Chrome's memory with your normal extensions enabled, then disable one suspect extension and repeat the same pages and actions in a fresh session. A repeatable drop that returns when you re-enable the extension is stronger evidence than one high reading.
Why is Memory Saver not deactivating a Chrome tab?
Chrome keeps some tabs active when they play audio or video, share a screen, show notifications, download files, contain a partially completed form, are pinned, or use a connected device. You may also have added the site to the always-active exception list.
Is high Chrome RAM usage always bad?
No. Browsers use available memory for active pages and caches, and that can make page switching faster. Treat it as a problem when the operating system shows sustained memory pressure, starts swapping heavily, closes apps, or when a single Chrome task grows without settling.
Will switching to Tabbit fix Chrome memory usage?
Tabbit can help if the practical cause is a pile of duplicate or expired tabs because Smart Tab Organization makes that pile easier to review and reduce. It cannot guarantee lower RAM for the same heavy site, repair a leaking extension, or replace more physical memory.