Skip to content
TabbitAgent case 01 / 05
English

Recorded session · one instruction · 4 tickers · 7 trading days

One instruction. Four tickers. Seven trading days.The agent plans. Tabbit does the browsing.

Doubao Work reads one sentence, calls Tabbit, and Tabbit drives a real browser on Eastmoney. The agent then cleans the data, rebases every ticker to 100 so a ¥9 ETF and a HK$1,195 stock can share one chart, and renders the report: line chart, daily table, seven-day summary, written conclusion.

4
tickers, 3 markets
7
trading days
1
instruction
5m 56s
task time on screen
Doubao Work × TabbitTaskCollect stock trendsElapsed5m 56s
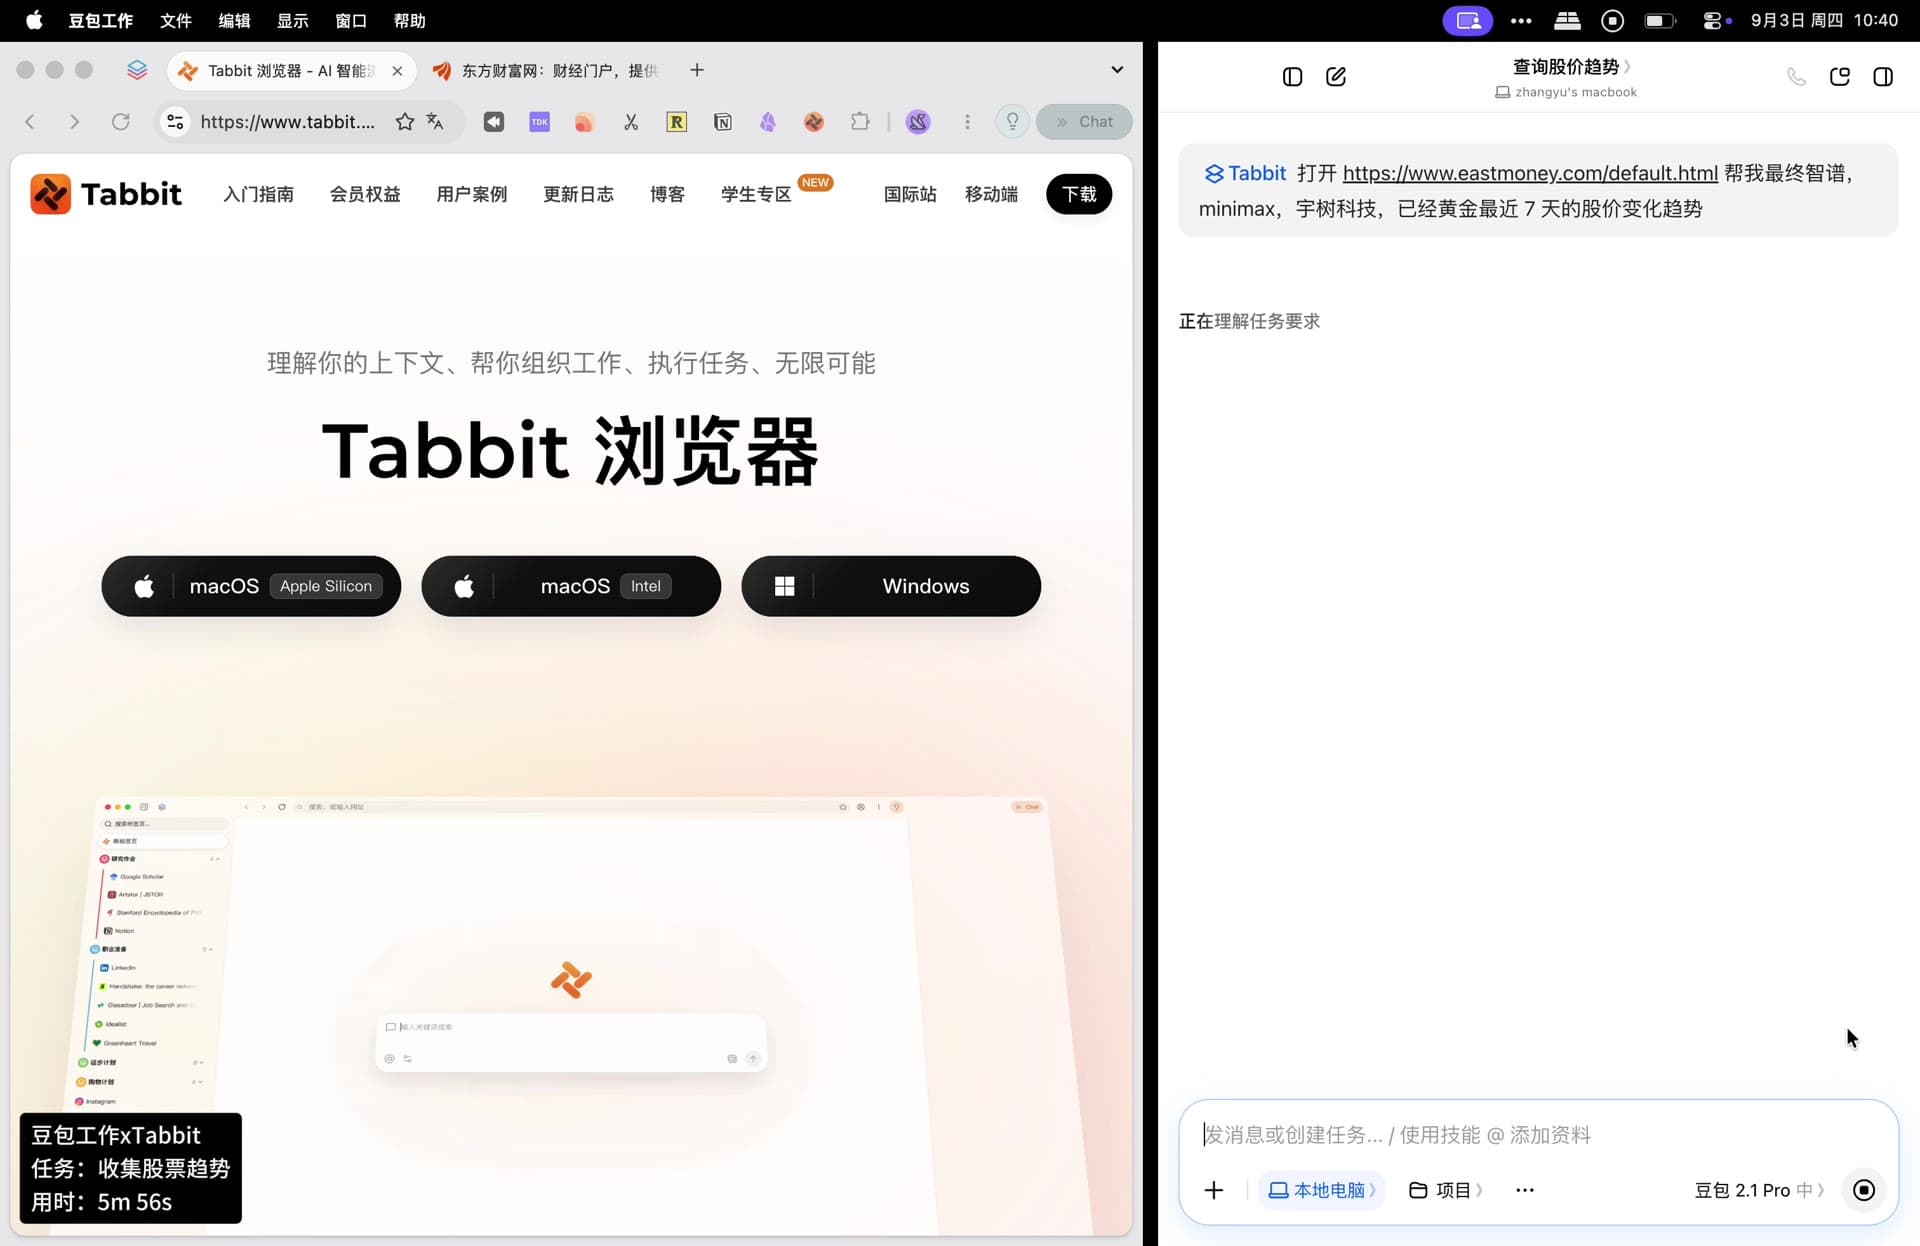
Split screen: Doubao Work on the right holds the stock-trend request while Tabbit on the left has the Eastmoney page open, with a status capsule reading “Doubao Work × Tabbit, task: collect stock trends, elapsed 5m 56s”.
The whole setup: one chat window, one browser, one status capsule.
The instruction, as typed

@Tabbit 打开 https://www.eastmoney.com/default.html 帮我查找智谱、MiniMax、宇树科技以及黄金最近 7 天的股价变化趋势

@Tabbit open https://www.eastmoney.com/default.html and find the 7-day price trend for Zhipu, MiniMax, Unitree Robotics and gold.

@Tabbit hands the browser work to Tabbit. Everything after it is plain language.

00 · The recording

Watch the agent hand work to the browser

Forty-one seconds, no cuts. Doubao Work keeps planning on the right; Tabbit keeps browsing on the left. Every number further down this page comes out of this session.

Recorded 2026-09-03. Data read from Eastmoney in a live browser session.

01 — Who decides, who acts

Two roles, one job

Nothing here is a hard-coded script. One side decides what to do; the other side actually does it in the browser.

Decision side · Doubao Work

Plans, maps the tickers, writes the report

  • Reads the request and breaks it into steps: open the site, look up four tickers, pull seven trading days each, then compare them.
  • Turns loose words into real instruments — “gold” becomes a listed fund that tracks domestic gold, “Unitree Robotics” becomes 688836.
  • Cleans the data, rebases it, then renders the chart and tables inside the chat.
Execution side · Tabbit

Drives a real browser, not a headless script

  • Opens Eastmoney in an ordinary browser session and reads the pages a person would read.
  • Shows its work: the capsule in the corner names the task and keeps the elapsed time on screen.
  • When the first page read returns zero rows, the agent keeps going and switches to the site’s search endpoint instead of failing.
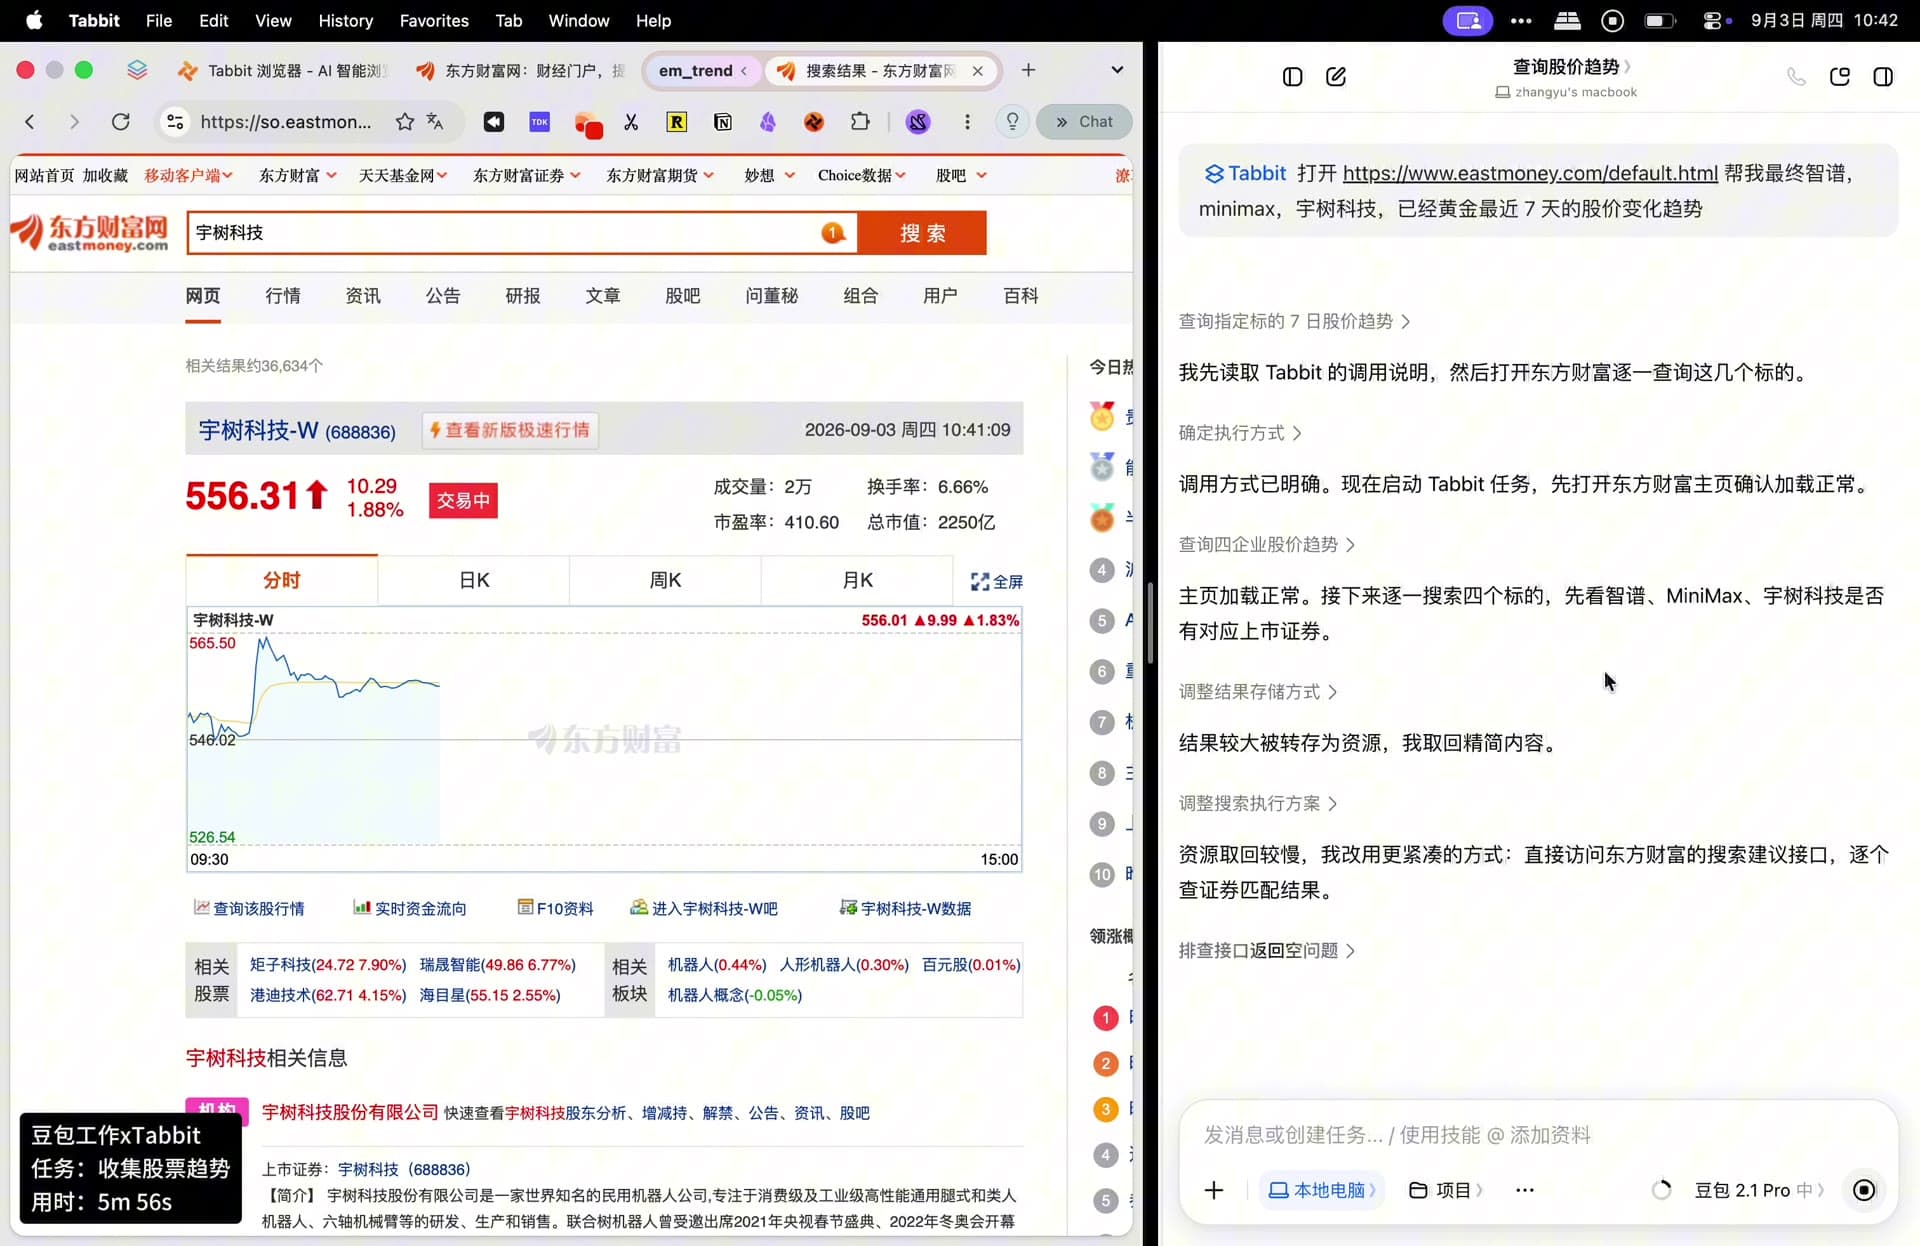
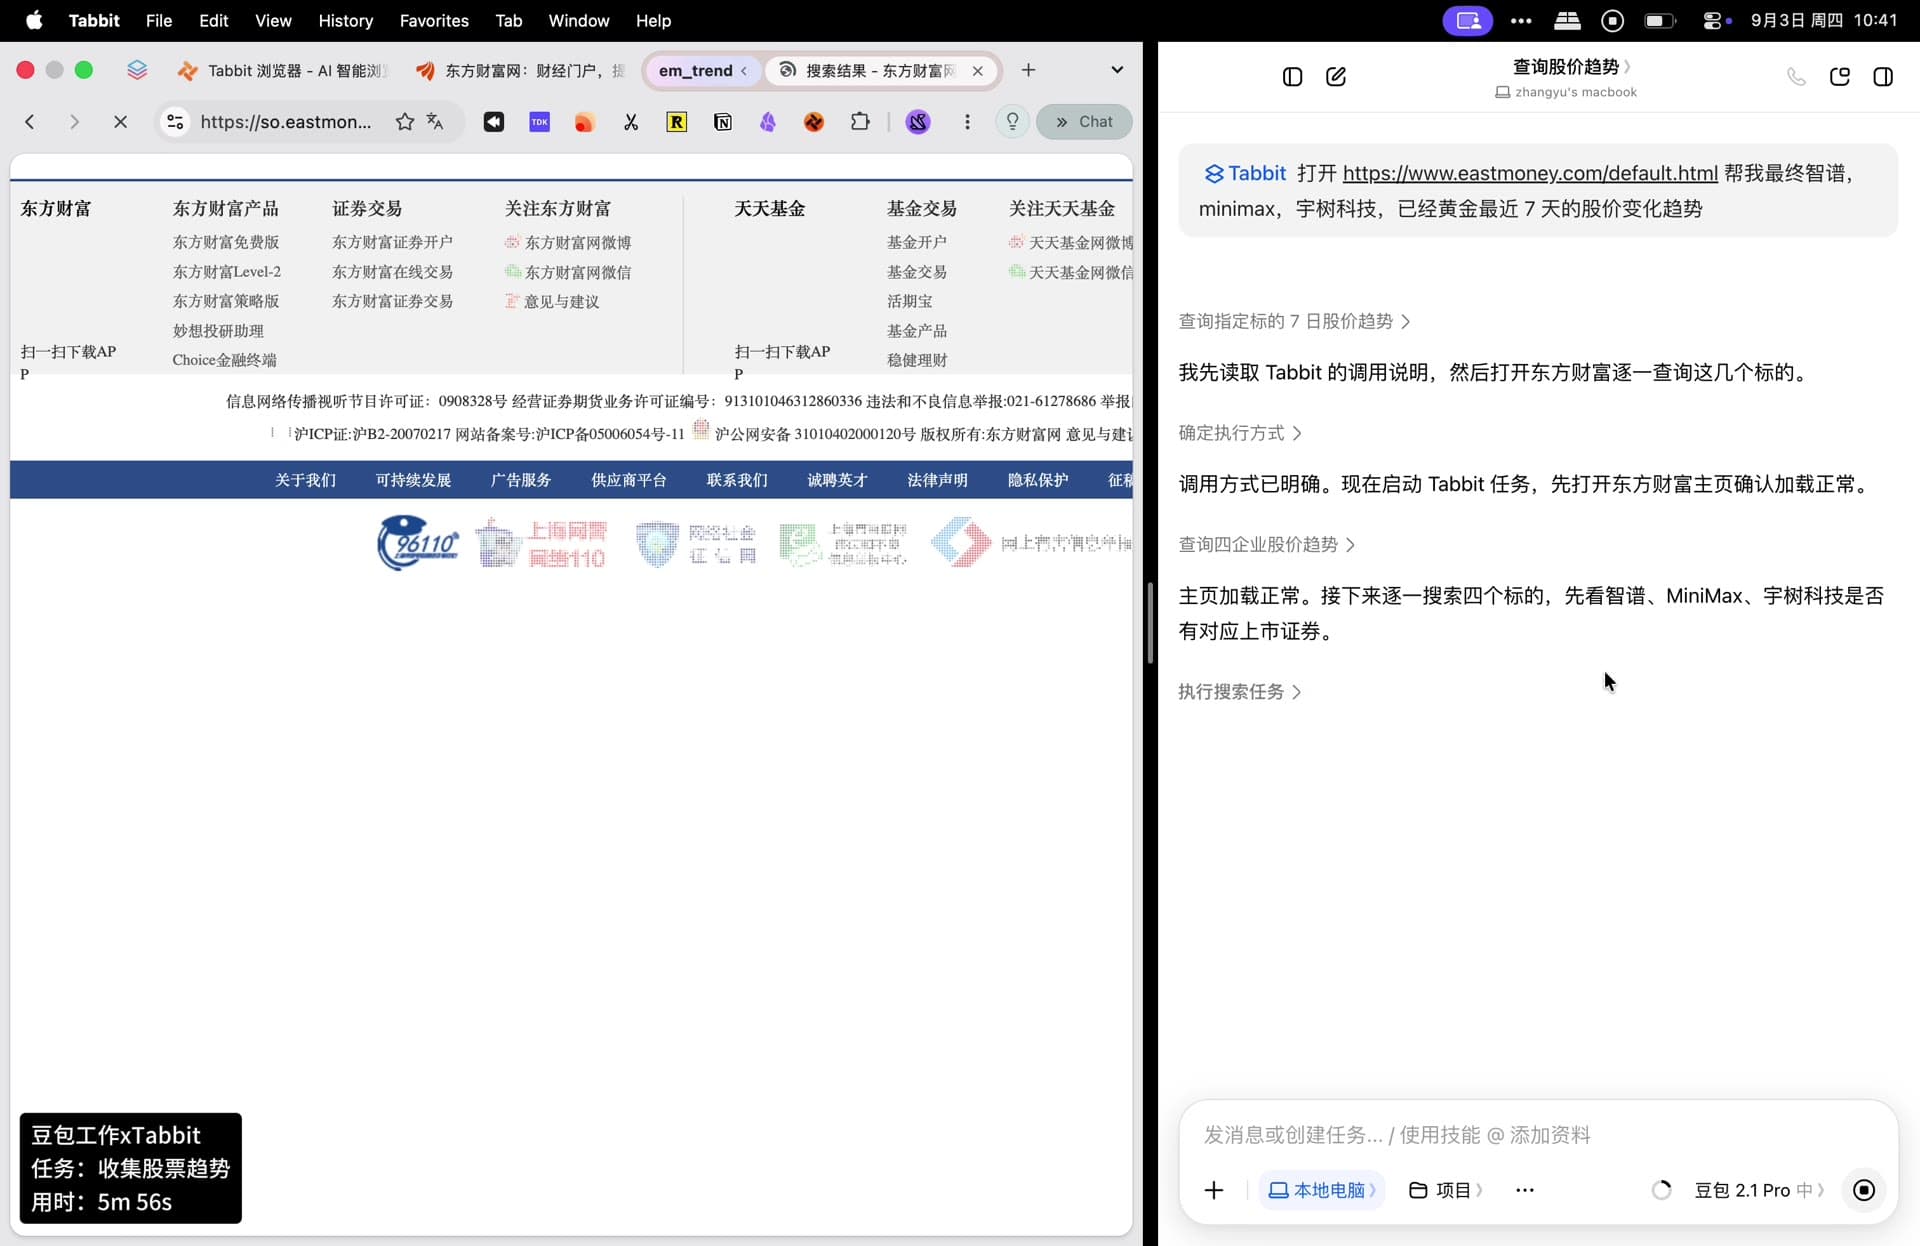
Doubao Work chat showing the plan “first I read Tabbit’s usage notes, then open Eastmoney and query each ticker one by one”, above a “confirm execution mode” step.
The plan is written out in the chat before the browser is touched.

02 — The run

Five steps from one sentence to a report

Timestamps are from the recording.

  1. 0100:00

    The instruction goes in

    One sentence covers four tickers, one site and a date range. @Tabbit is what hands the browsing to Tabbit.

  2. 0200:00 – 00:05

    The agent plans, then opens the page

    Doubao Work reads Tabbit’s usage notes first, opens the Eastmoney home page and confirms it loaded.

  3. 0300:05 – 00:20

    Tickers get mapped — and the first attempt fails

    Gold is mapped to 518880, a liquid fund tracking domestic gold; MiniMax to 00100; Zhipu to 02513; Unitree to 688836. The first page read comes back with zero rows, so the agent switches to the site’s search endpoint.

  4. 0400:20 – 00:30

    Data is cleaned and rebased

    Seven trading days per ticker. Because the prices differ by two orders of magnitude, every series is rebased to 100 at the 8/25 close.

  5. 0500:30 – 00:40

    The report is rendered

    A normalised line chart, a daily close table with day-over-day changes, a seven-day summary, and a written read of what happened.

Tabbit showing the Eastmoney search results page for Unitree Robotics-W (688836) at 556.311, up 1.88%, with intraday and daily K-line tabs, turnover rate and market cap.
Real page, real numbers: Tabbit reading the Unitree quote on Eastmoney.

03 — What came out

One chart, three tables, one conclusion

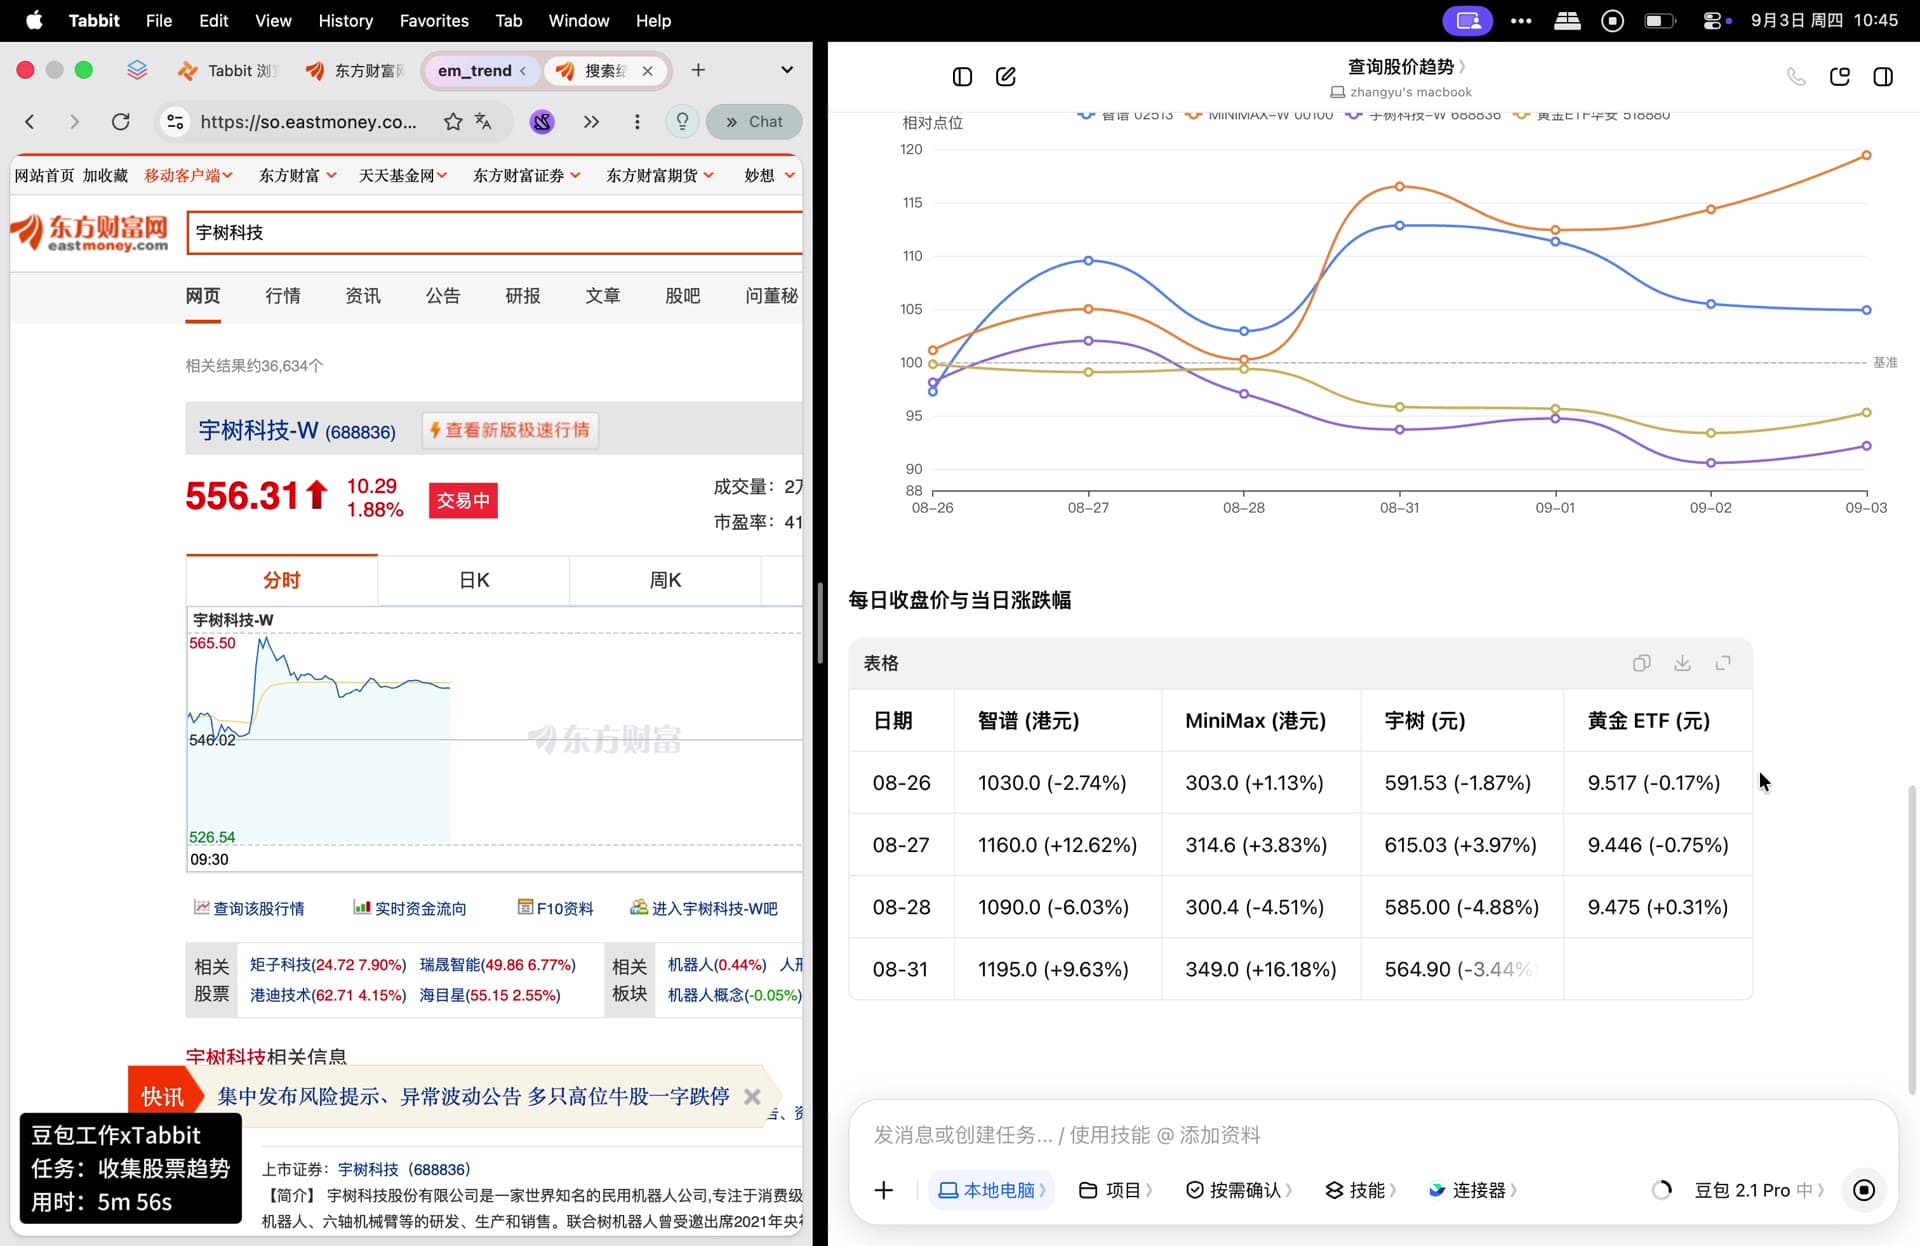
The agent rebased every series to 100 at the 8/25 close, so a ¥9 ETF and a HK$1,195 stock can be compared on one axis. Everything below is rendered from the numbers the report produced.

Relative level, 8/25 close = 100

Higher means stronger over the window. The dotted line is the baseline.

MiniMax-W119.4Zhipu104.9Unitree Robotics-W92.2Gold ETF (Huaan)95.3
Rebased price series9095100105110115120Relative level08-2608-2708-2808-3109-0109-0209-03

Baseline 100

Daily close and day-over-day change

DateMiniMax-WHKDZhipuHKDUnitree Robotics-WCNYGold ETF (Huaan)CNY
08-26303.00 1.13%1030.00 2.74%591.53 1.87%9.517 0.17%
08-27314.60 3.83%1160.00 12.62%615.03 3.97%9.446 0.75%
08-28300.40 4.51%1090.00 6.03%585.00 4.88%9.475 0.31%
08-31349.00 16.18%1195.00 9.63%564.90 3.44%9.135 3.59%
09-01336.80 3.50%1179.00 1.34%571.10 1.10%9.118 0.19%
09-02342.60 1.72%1117.00 5.26%546.02 4.39%8.902 2.37%
09-03357.80 4.44%1111.00 0.54%555.65 1.76%9.085 2.06%

09-03 is an intraday read, not a closing price.

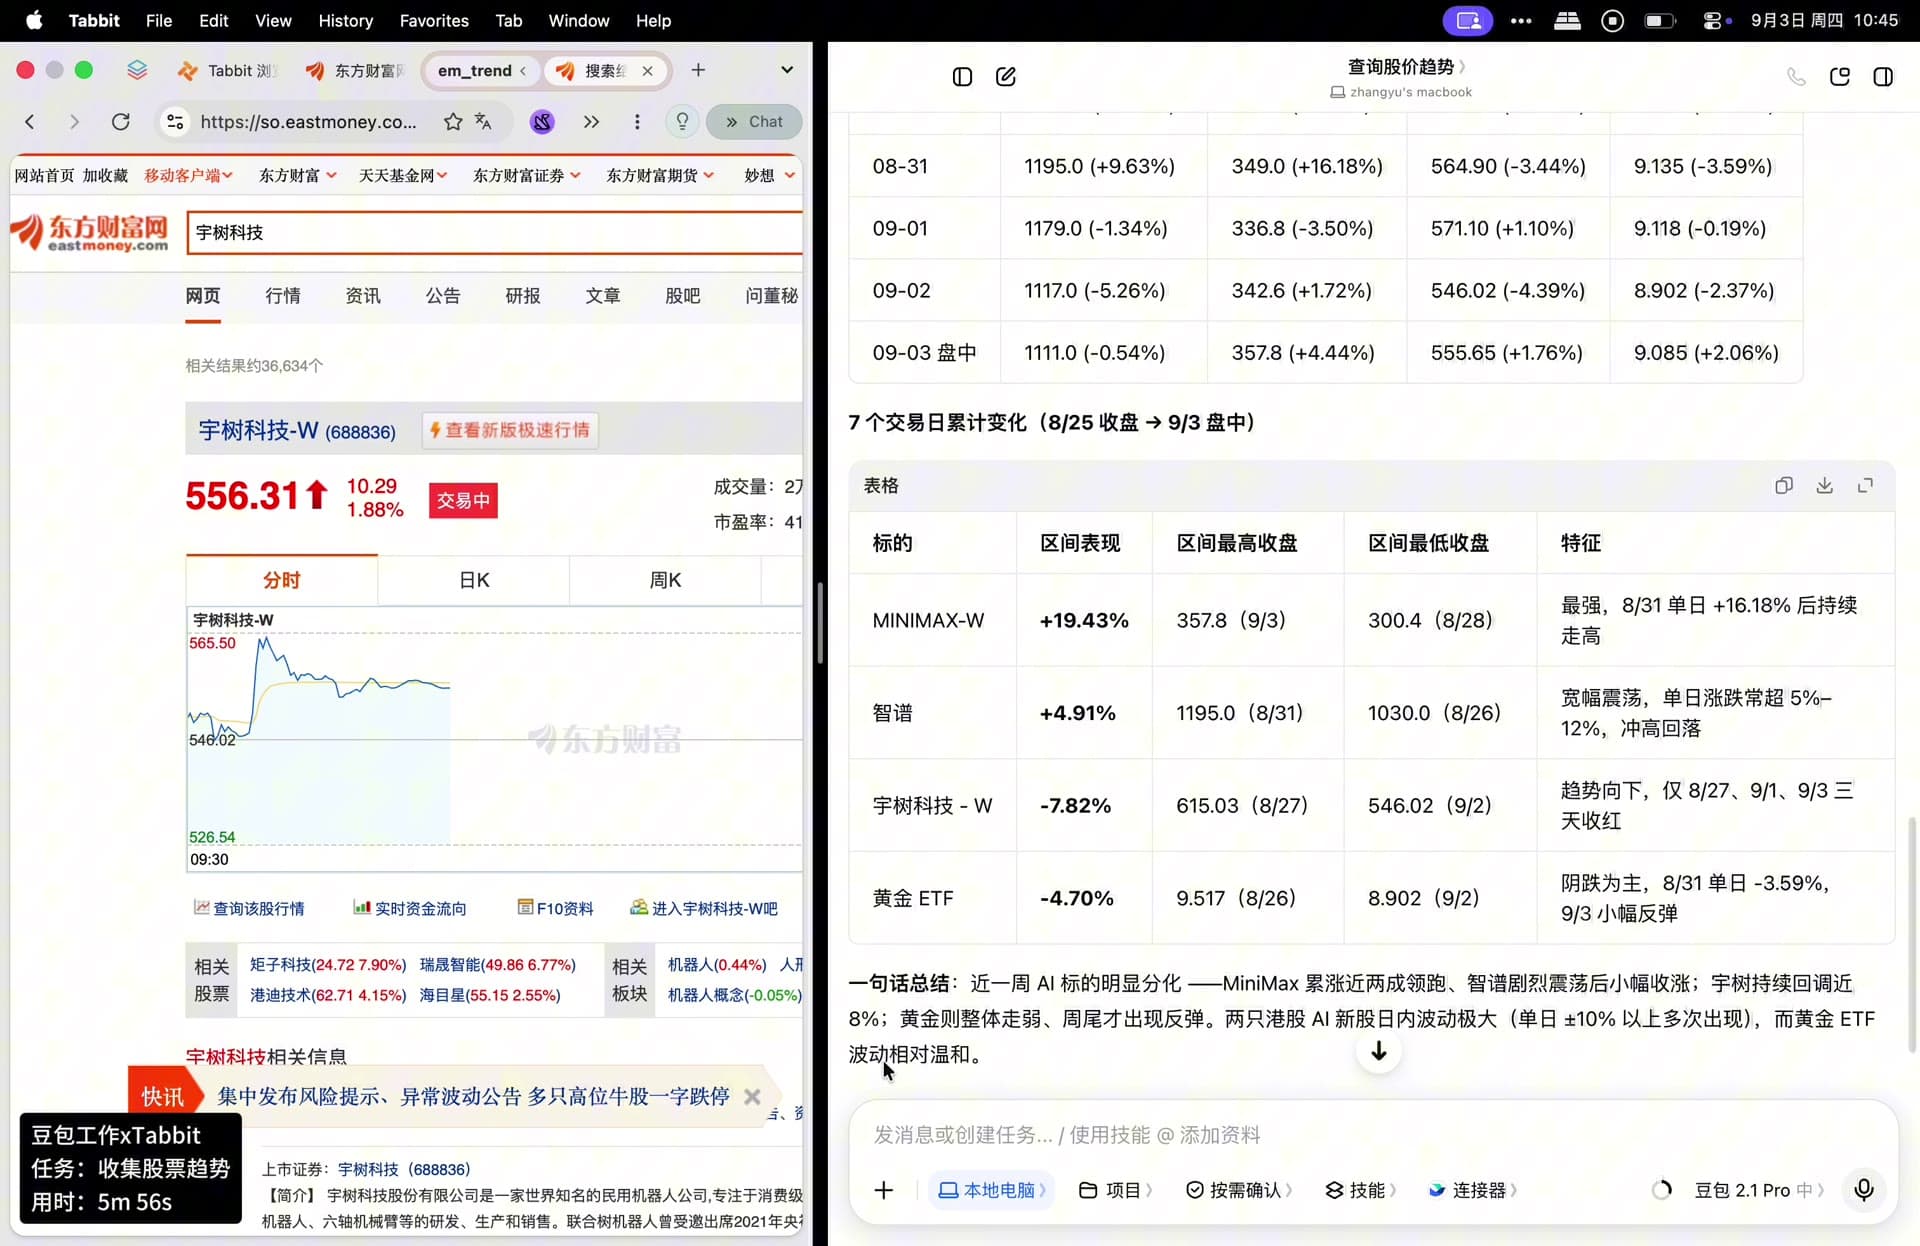
Seven trading days, one table (8/25 close → 9/3 intraday)

TickerWindow returnHigh closeLow closeWhat it did
MiniMax-W00100+19.43%357.8009-03300.4008-28Strongest series; +16.18% on 8/31 and kept climbing.
Zhipu02513+4.91%1195.0008-311030.0008-26Wide swings; single-day moves of 5–12%, spiked then faded.
Unitree Robotics-W6888367.82%615.0308-27546.0209-02Downtrend; only three up days in the window.
Gold ETF (Huaan)5188804.70%9.51708-268.90209-02Grinding lower, −3.59% on 8/31.
Report pane in Doubao Work showing the rebased line chart and a daily close table for Zhipu, MiniMax, Unitree and the gold ETF.
The chart and the daily table, rendered inside the chat.
Report pane in Doubao Work showing the seven-trading-day summary table with window returns of +19.43%, +4.91%, −7.82% and −4.70%.
The seven-day summary table that closes the report.

This page is a product demonstration, not investment advice. Figures are as published in the recorded report: 8/25 close as the baseline, 9/3 intraday as the end point, source Eastmoney.

04 — Why it works

Three things make this combination hold up

None of them are about model size.

01

The browser is the integration

Eastmoney needs no API key, no SDK and no scraping script. If a person can read it in a browser, the agent can read it too — including the pages that only render after a click.

02

Normalisation is the step people skip

Put a ¥9 fund and a HK$1,195 stock on the same axis and you get one flat line and no insight. Rebasing every series to the first close is what makes four very different instruments comparable.

03

The output is the deliverable

You do not get raw JSON to clean up. You get the chart, the tables and the conclusion, ready to drop into a deck or a memo.

05 — Reproduce it

Four prompts that make the run smoother

Copy these into any agent that can call Tabbit.

01

Name the authoritative site and URL

Naming the site and the exact URL stops the agent from comparing figures across five different sources. Reuse the instruction at the top of this page as the template.

02

Ask for normalisation when price scales differ

This is the single sentence that turns four unrelated quotes into a comparable chart.

Prompt

If the price ranges differ a lot, rebase every series to the first close = 100 and plot them on one line chart.

03

Let it map loose concepts, but ask it to declare the mapping

Words like “gold” or “robot leaders” are not instruments. Ask the agent to state which security it picked, so you can check the choice instead of guessing.

Prompt

If a term maps to a specific instrument, list the code and name at the top of the report.

04

Constrain the output format

Rich tables and charts are the point. Say so up front and you skip the “summarise this again” round trip.

Prompt

Output in this order: 1) ticker mapping and data source; 2) rebased line chart; 3) daily close table with changes; 4) seven-day summary and key takeaways.

06 — Keep reading

The Agent + Tabbit case series

Same pattern, five different jobs: a general agent does the thinking, Tabbit does the browsing.

Related reading

How fast is a browser agent, really?

We benchmarked Tabbit CLI against the Codex Chrome takeover and Vercel Labs Agent Browser: 25 tasks, 225 runs, blind-judged.

Read the benchmark report

FAQ

Questions this demo usually raises

Do I need to write code?

No. The whole session is one sentence typed into Doubao Work. Tabbit exposes browser control to the agent, so there is nothing to script, no selectors to maintain and no headless browser to configure.

Where does the data come from?

From Eastmoney’s public pages, read by Tabbit in a real browser session. The page in the recording is the page a person would see, including the login-free quote pages.

Why rebase every series to 100?

Because the tickers trade at very different prices. On 8/25 the gold ETF closed near ¥9.5 while Zhipu traded above HK$1,000. On a shared absolute axis the ETF would be a flat line at the bottom. Setting the 8/25 close to 100 for every series turns four price levels into four comparable trend lines.

What happens when a page returns nothing?

In this session the first read came back with zero rows. Instead of stopping, the agent diagnosed the failure and switched to the site’s search endpoint, which returned the data reliably.

Is any of this investment advice?

No. This is a demonstration of what a browser agent can finish end to end. The figures are a snapshot: 8/25 close as the baseline, 9/3 intraday as the end point, and they will be out of date the moment you read them.

Try it

Point your agent at a real browser

Install Tabbit, mention @Tabbit in whichever agent you already use, and let it work on the pages you actually read.

macOS and Windows. Free to download.

© 2026 Tabbit Browser. The AI-native browser that understands your context.